Creating a Redfish Monitoring Infrastructure
View on GitHubCreating a Redfish Monitoring Infrastructure
- Creating a Redfish Monitoring Infrastructure
Introduction
Section titled “Introduction”This document explains how to set up a simple Redfish Monitoring Infrastructure from scratch on Rocky Linux 9. The purpose of this repository is to demonstrate a simple workflow. In production, there are a number of things you will want to do to make this more robust. For example, I only show how to do this with temperature with a simple data exporter. Depending on your use case, you may want to create your own exporter, but others exist, for example sapcc/redfish-exporter.
Architecture
Section titled “Architecture” +------------------------+ | Grafana | | (Dashboards) | +-----------+------------+ | ▼ +---------------+ | Prometheus | | (Time Series) | +-------+-------+ ▲ | +--------+-------------+ | Redfish Exporter | | (Exposes /metrics) | +--------+-------------+ ▲ | +---------------+---------------+ | |+--------------------+ +--------------------+| Redfish-Enabled | | Redfish-Enabled || Server / PDU | | IRC / CDU Device |+--------------------+ +--------------------+Grafana (Dashboards)
Section titled “Grafana (Dashboards)”Grafana is a visualization platform that provides real-time dashboards and historical views of time-series data. In this infrastructure, it connects to Prometheus as a data source to display charts, gauges, and alerts based on the metrics collected from Redfish-enabled devices. Users can interact with dashboards to monitor device temperatures, fan speeds, power draw, and other health indicators. Grafana also supports custom alerting rules and can send notifications when thresholds are exceeded.
Prometheus (Time Series Database)
Section titled “Prometheus (Time Series Database)”Prometheus is a pull-based monitoring system and time-series database. It scrapes the Redfish Exporter’s /metrics endpoint at regular intervals and stores the data along with timestamps. It provides a query language (PromQL) to filter, aggregate, and analyze metrics. Prometheus is responsible for managing retention policies, generating alerts based on rules, and serving data to Grafana or other clients.
Redfish Exporter (Exposes /metrics)
Section titled “Redfish Exporter (Exposes /metrics)”The Redfish Exporter is a lightweight Flask or FastAPI application that exposes a /metrics endpoint in Prometheus text format. It reads metrics written to a local metrics.prom file by the Redfish Poller. The exporter acts as a bridge between the file-based output of the poller and Prometheus’ HTTP-based scraping model. It does not collect data itself but serves the latest available data for Prometheus to consume.
Redfish Poller (not shown in diagram, runs beneath Exporter)
Section titled “Redfish Poller (not shown in diagram, runs beneath Exporter)”The Redfish Poller is a custom Python script that authenticates to each Redfish-enabled device, queries specific Redfish API endpoints (e.g., Thermal, Power), and extracts structured metrics. It formats this data into Prometheus-compatible text and writes it to a metrics.prom file. The poller runs continuously in a loop, updating the file at fixed intervals (e.g., every 15 seconds).
Redfish-Enabled Server / PDU
Section titled “Redfish-Enabled Server / PDU”These are physical or virtual devices such as servers and power distribution units that expose Redfish APIs for telemetry and control. Common metrics retrieved from servers include CPU temperature, inlet/outlet temperature, fan speeds, and power consumption. Redfish is typically implemented on out-of-band management controllers like iDRAC (Dell), iLO (HPE), or BMCs (Baseboard Management Controllers).
Redfish-Enabled IRC / CDU Device
Section titled “Redfish-Enabled IRC / CDU Device”IRC (Intelligent Rack Controller) and CDU (Cooling Distribution Unit) devices also support Redfish and provide metrics for rack-level or cooling infrastructure. The poller queries them just like servers, accessing Redfish endpoints to retrieve environmental metrics such as ambient temperature, rack airflow, or coolant levels, depending on device capabilities.
Prerequisites
Section titled “Prerequisites”- Rocky Linux 9
- Network access to Redfish-enabled devices (e.g., Dell iDRAC, PDU, IRC, or CDU)
- Python 3.9+ and
pip - Podman (used in place of Docker)
Step-by-Step Setup on Rocky Linux 9
Section titled “Step-by-Step Setup on Rocky Linux 9”1. Install Required Packages
Section titled “1. Install Required Packages”sudo dnf install -y python3 python3-pip podman podman-docker gitOptional: create /etc/containers/nodocker to suppress Docker compatibility warnings:
sudo touch /etc/containers/nodocker2. Clone the Project
Section titled “2. Clone the Project”git clone --depth 1 --filter=blob:none --sparse https://github.com/grantcurell/projects.gitcd projectsgit sparse-checkout set "Creating a Redfish Monitoring Infrastructure"cd "Creating a Redfish Monitoring Infrastructure"3. Edit devices.yaml
Section titled “3. Edit devices.yaml”Update this with all the servers you wish to monitor.
devices: - name: fx21 ip: 10.10.25.109 username: root password: changeme - name: fx22 ip: 10.10.25.110 username: root password: changeme4. Install Python Requirements
Section titled “4. Install Python Requirements”pip install -r requirements.txt5. Run the Exporter and Poller
Section titled “5. Run the Exporter and Poller”Terminal 1 (Exporter):
python3 exporter/app.pyTerminal 2 (Poller):
python3 poller/poller.pyTest it:
curl http://localhost:8000/metricsYou should see something that looks like this:
[root@rockyvm1 ~]# curl http://localhost:8000/metricsredfish_temperature_celsius{device="fx22",sensor="CPU1_Temp"} 44redfish_temperature_celsius{device="fx22",sensor="System_Board_Inlet_Temp"} 15redfish_temperature_celsius{device="fx22",sensor="Chassis_Ambient_Temp"} 22redfish_temperature_celsius{device="fx22",sensor="CPU2_Temp"} 42redfish_temperature_celsius{device="fx21",sensor="System_Board_Inlet_Temp"} 21redfish_temperature_celsius{device="fx21",sensor="CPU1_Temp"} 45redfish_temperature_celsius{device="fx21",sensor="CPU2_Temp"} 39redfish_temperature_celsius{device="fx21",sensor="Chassis_Ambient_Temp"} 226. Configure Prometheus
Section titled “6. Configure Prometheus”Update prometheus.yml in the root of the project with your target host(s). I have it setup to only look at localhost as I assume you ran the exporter and poller on the same host as Prometheus. It is likely in production that won’t be the case.:
global:  scrape_interval: 15s
scrape_configs:  - job_name: 'redfish_exporter'    static_configs:      - targets: ['localhost:8000']
7. Run Prometheus via Podman
Section titled “7. Run Prometheus via Podman”podman run -p 9090:9090 \ -v "$(pwd)/prometheus.yml:/etc/prometheus/prometheus.yml:ro" \ docker.io/prom/prometheusThen open:
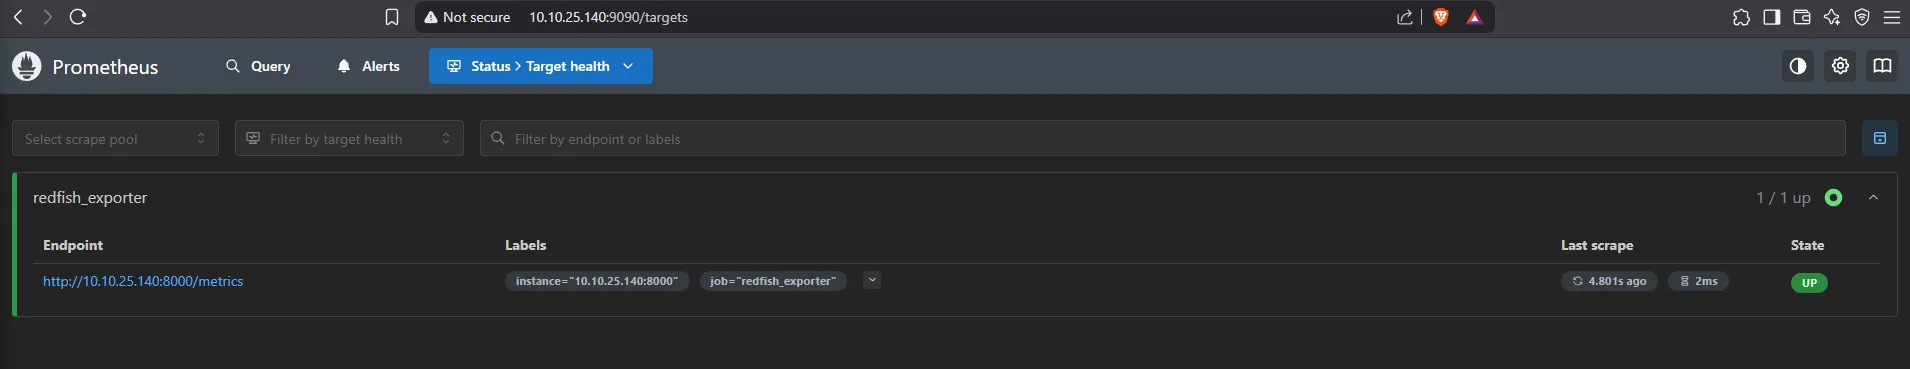
http://localhost:9090Check under Status → Targets to see if redfish_exporter is listed and UP.
Try query:
redfish_temperature_celsius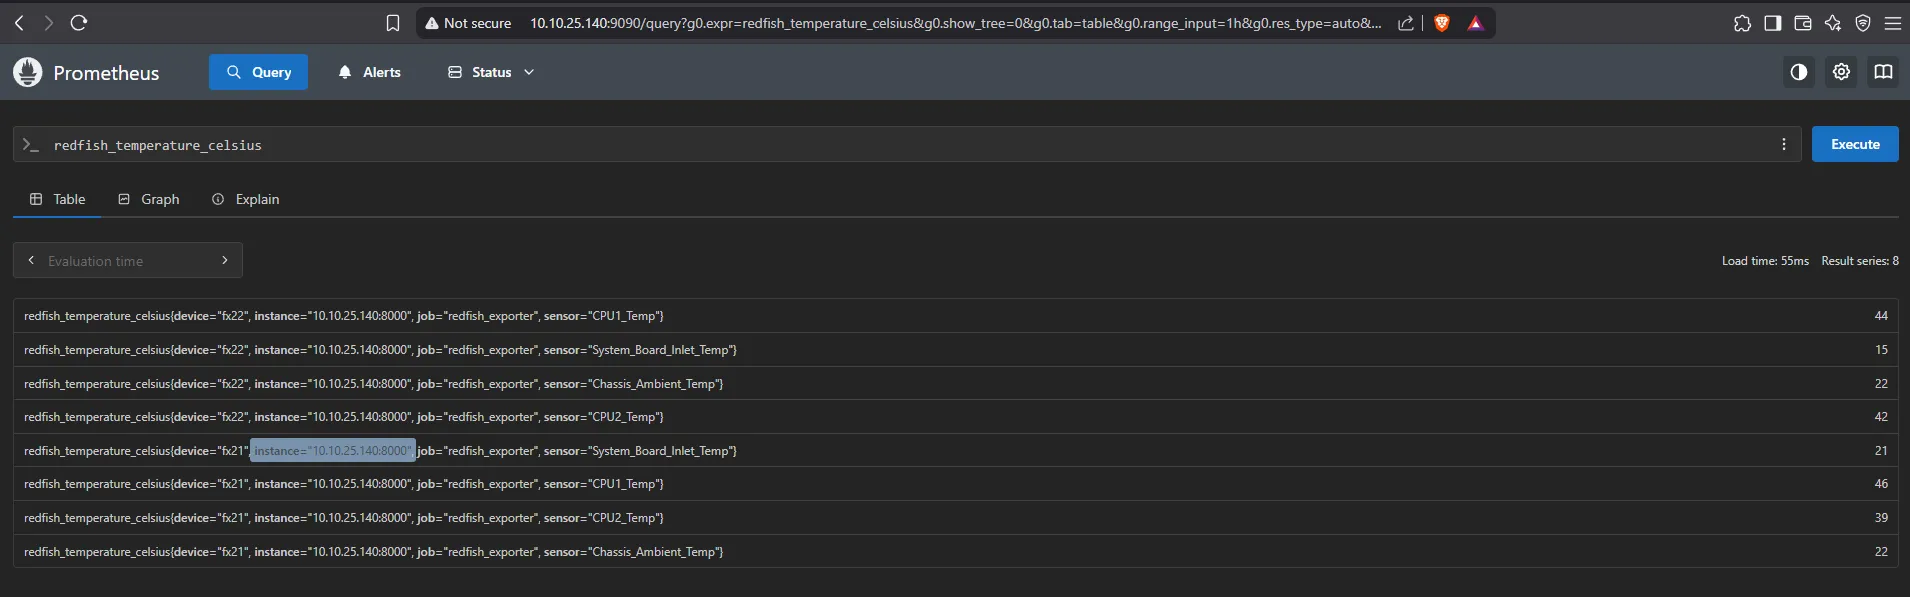
8. Run Grafana via Podman
Section titled “8. Run Grafana via Podman”podman run -d --name=grafana \ -p 3000:3000 \ docker.io/grafana/grafanaTo persist dashboards across reboots:
mkdir -p grafana-storagepodman run -d --name=grafana \ -p 3000:3000 \ -v $(pwd)/grafana-storage:/var/lib/grafana \ docker.io/grafana/grafana9. Configure Grafana and Create Dashboards
Section titled “9. Configure Grafana and Create Dashboards”-
Visit Grafana: http://localhost:3000
-
Login:
admin/admin(you’ll be asked to change the password) -
Go to Connections → Data Sources → Add Data Source
-
Choose Prometheus
-
Set URL to:
http://localhost:9090orhttp://<your-host-ip>:9090 -
Click Save & Test
-
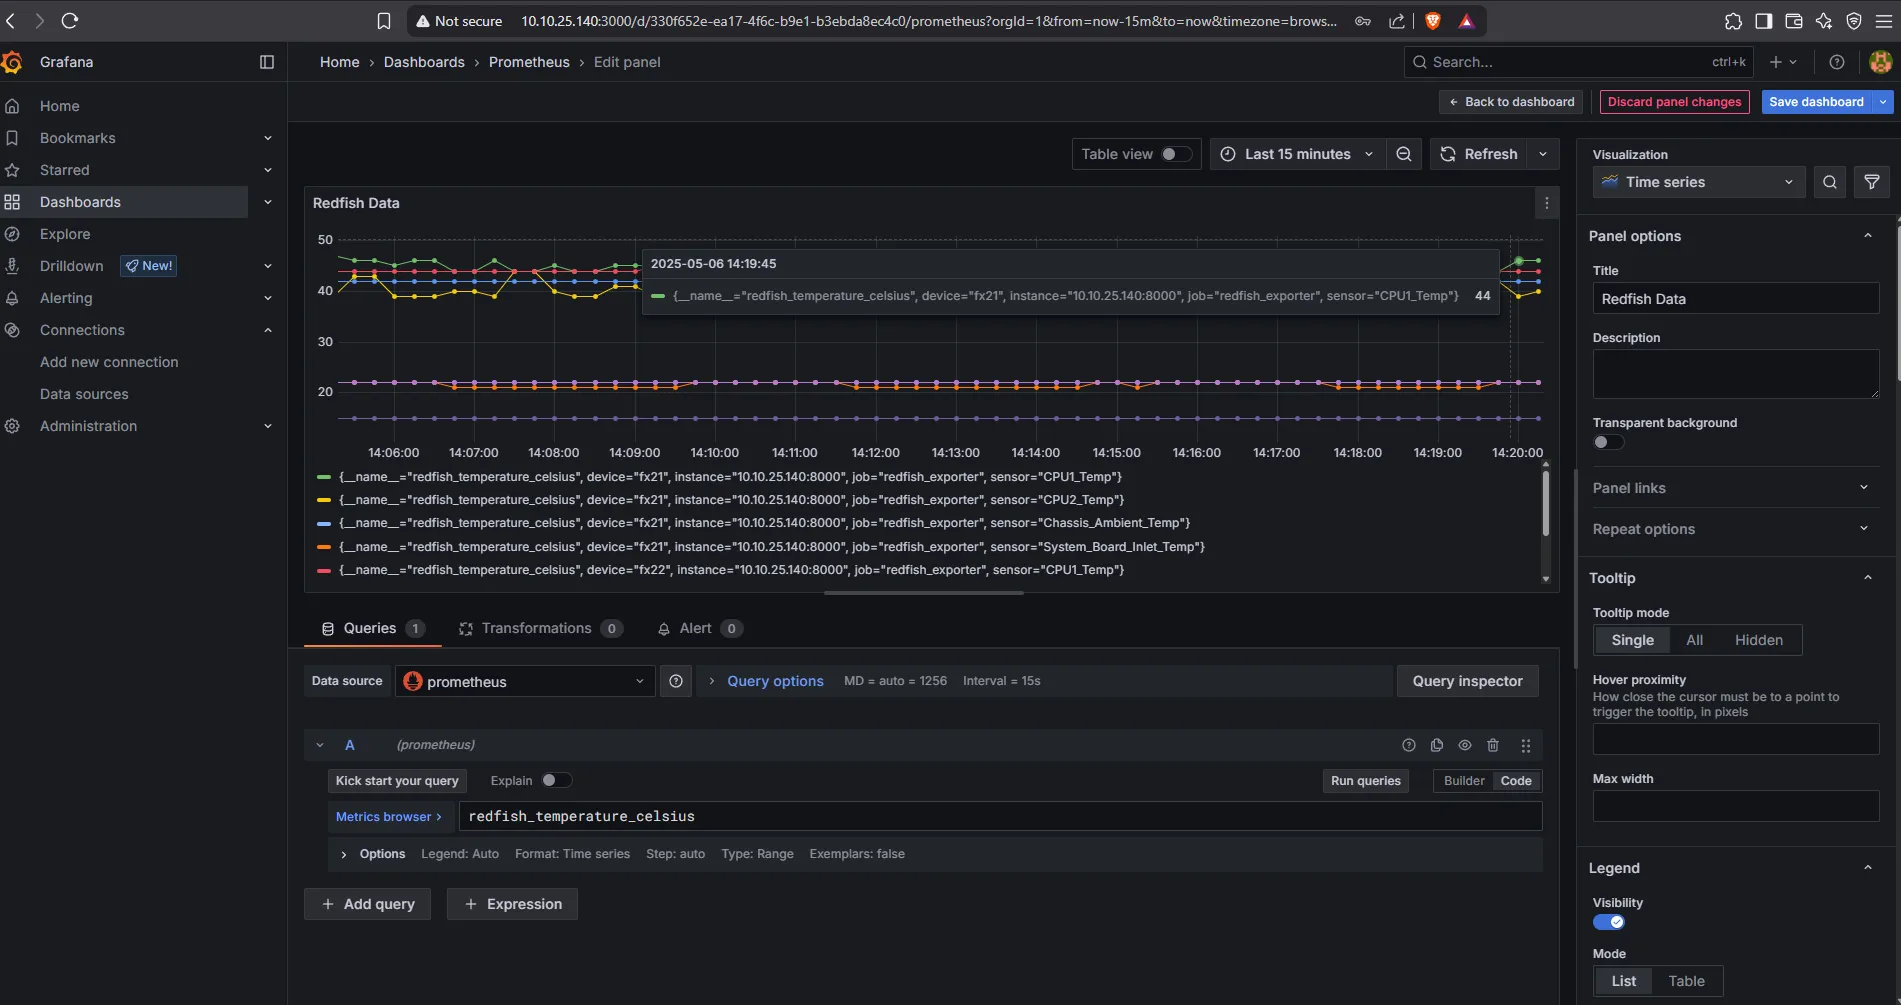
Create a Dashboard:
- Go to Dashboards → New → New Dashboard → Add visualization\
- Select prometheus
- On the right, next to “Run queries” select Code instead of Builder
- Query:
redfish_temperature_celsius - Click Run queries
- Save the dashboard
✅ Done!
Section titled “✅ Done!”You now have:
- A Python-based Redfish metric poller
- An exporter serving Prometheus-formatted metrics
- Prometheus scraping the exporter
- Grafana visualizing hardware telemetry
Controlling Redfish-Enabled Devices
Section titled “Controlling Redfish-Enabled Devices”This project demonstrates a best-practices-compliant method for collecting telemetry using Redfish. However, controlling devices via Redfish is far less standardized — nearly every vendor implements control features differently.
Dell Resources
Section titled “Dell Resources”Dell provides several tools and examples to support Redfish-based control:
-
Redfish Python API Examples https://github.com/dell/iDRAC-Redfish-Scripting
-
Dell EMC Ansible Modules Note: This refers to Ansible modules, not the OpenManage Enterprise product itself. https://galaxy.ansible.com/ui/repo/published/dellemc/openmanage/
APC PDUs
Section titled “APC PDUs”For APC Power Distribution Units (PDUs), Redfish support varies. Jeet has written examples that may help:
Additionally, APC publishes Redfish documentation and a control manual for supported models.